Limitations
Missing Values in Vertical Section Charts
-
Masked Areas Without Original Data
When generating time-series vertical section charts of Argo float data, linear 1D interpolation is used in two steps: first each profile is interpolated onto a common pressure grid, then values are interpolated along the cycle/time direction. Some areas may remain unfilled where original profile data are missing. To address this, masks are applied after interpolation to exclude regions without valid observations, setting those values to NaN.
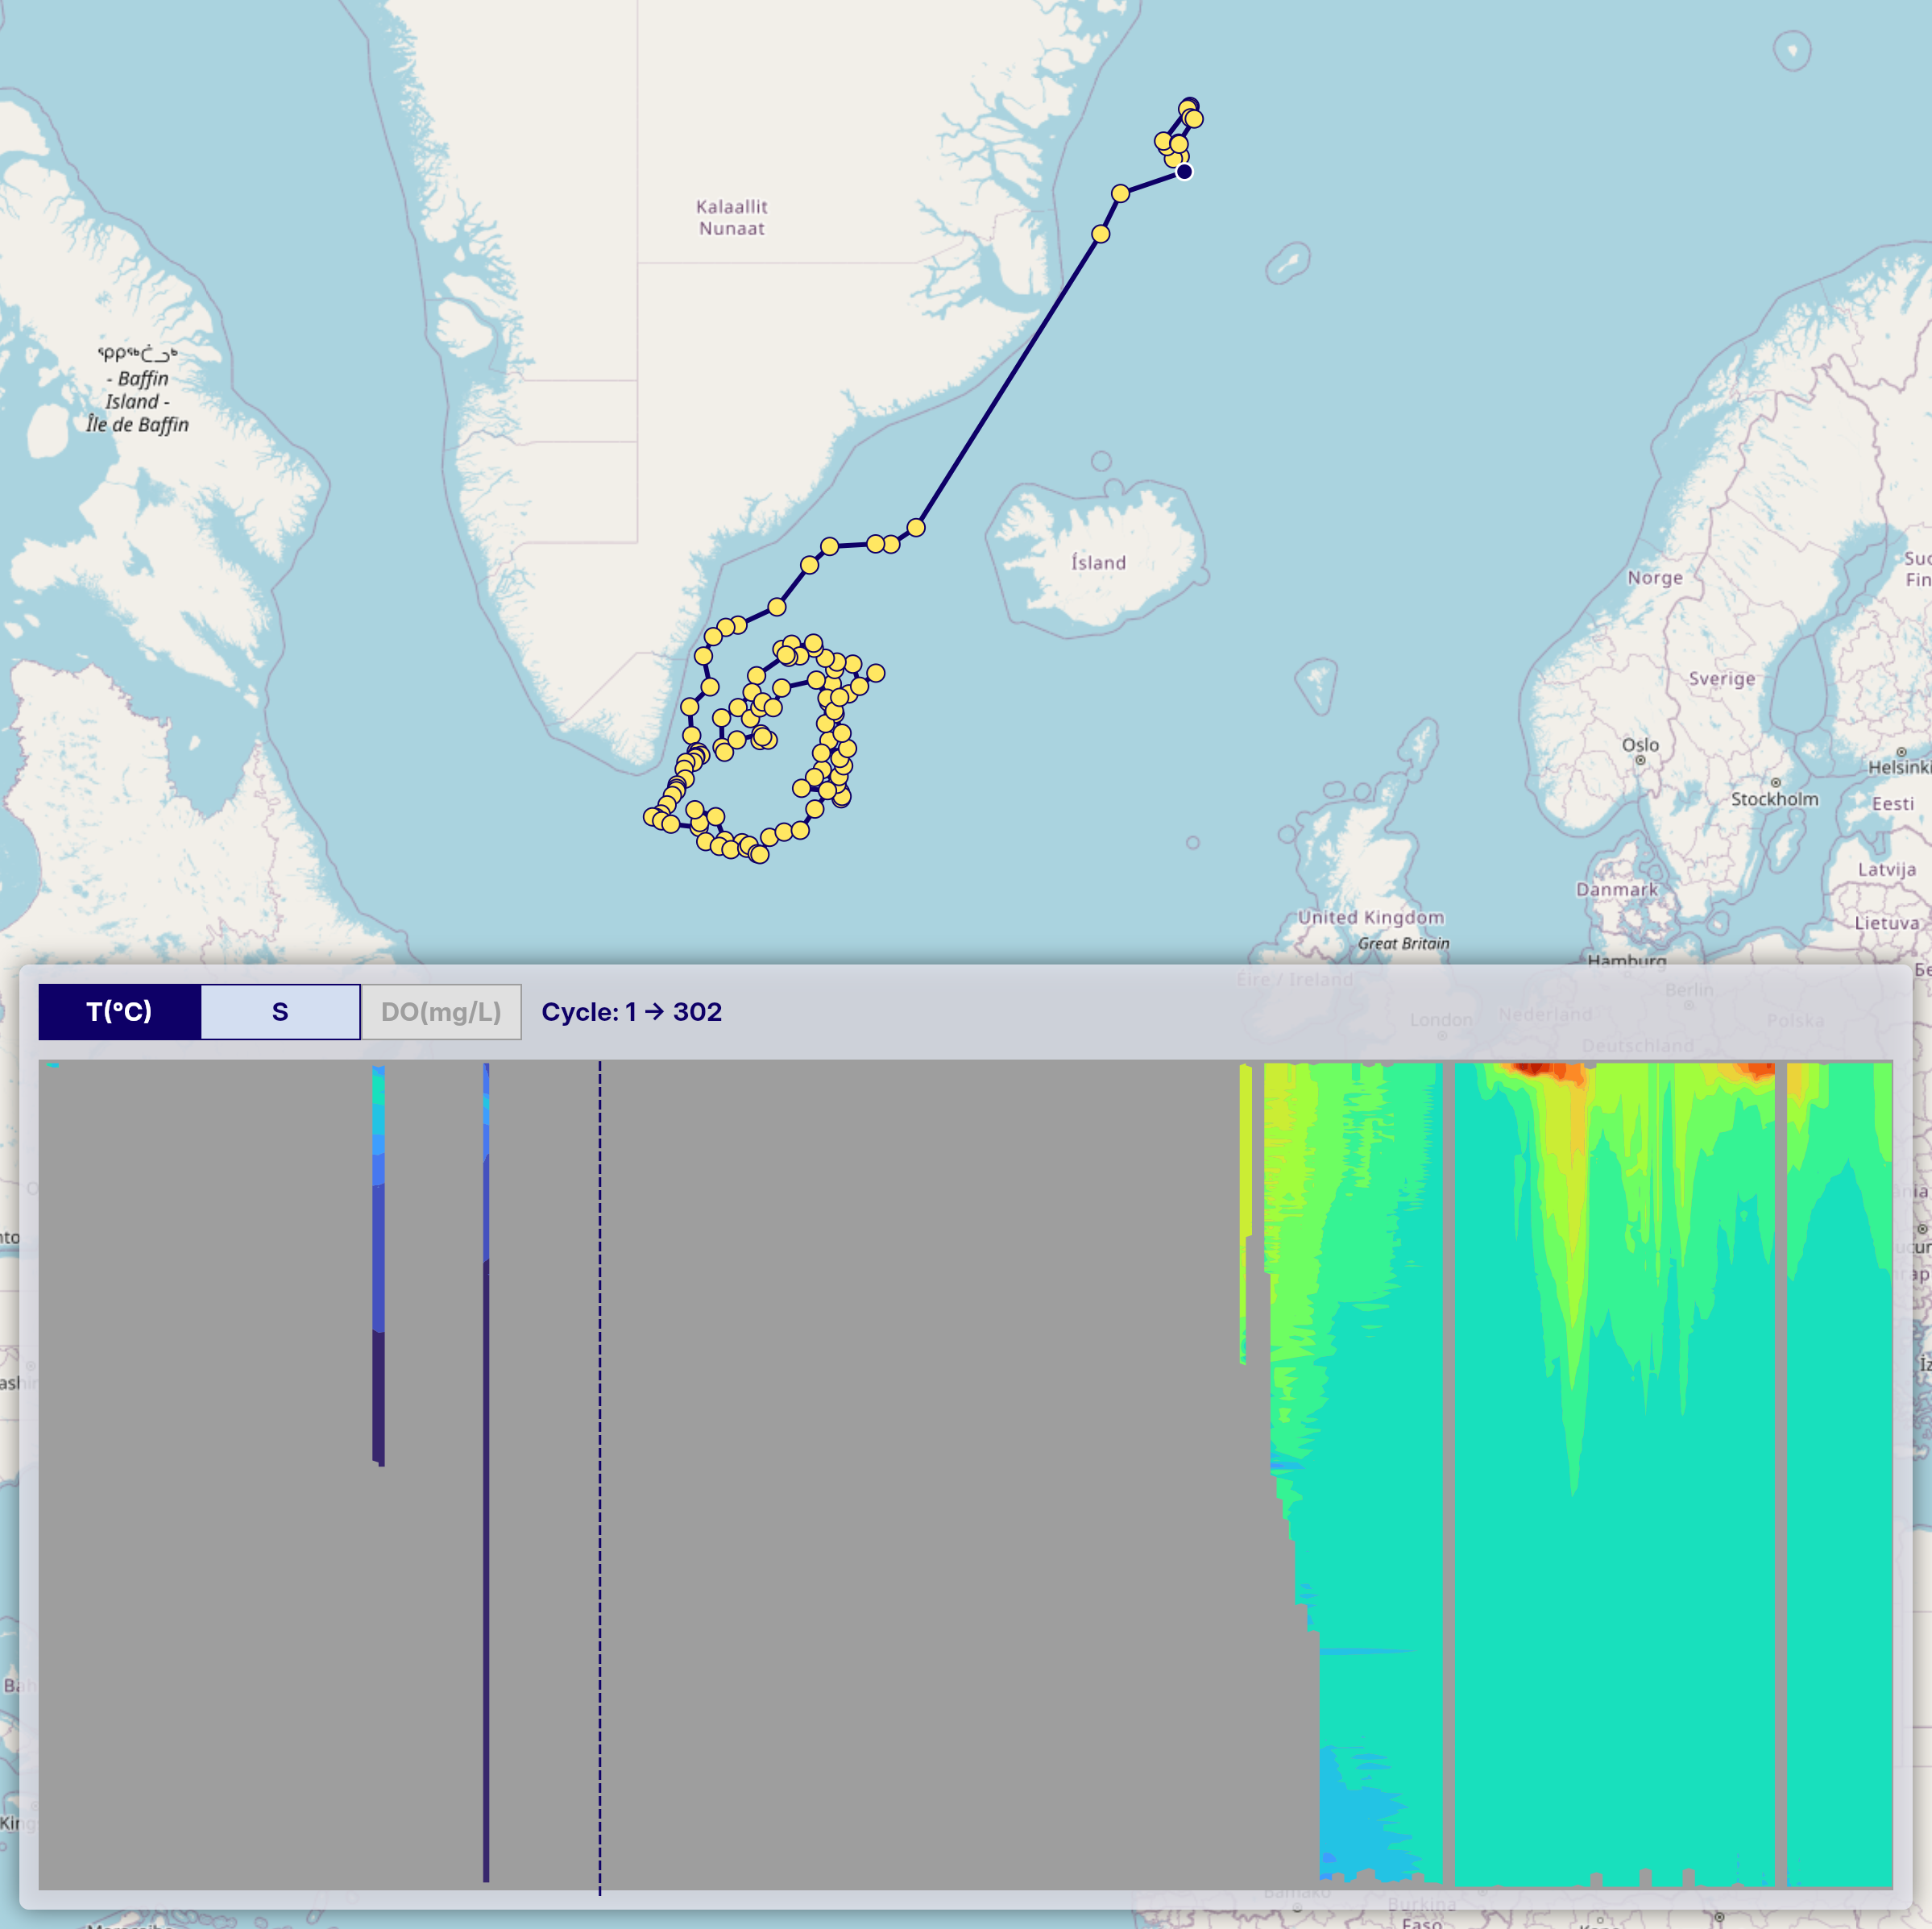
In the example image below, these masked areas appear as uncolored gaps in the vertical section.
-
Sparse Data Due to Quality Control
After applying quality control, some profiles may be excluded, resulting in a sparser time series. Even if valid profiles are present at certain time steps, the interpolation process may not be able to generate a continuous vertical section. This leads to sections where observation points exist (trajectory figure) but the interpolated chart shows gray or missing areas (vertical section figure), indicating insufficient data density for interpolation.
This can be seen in the same image where gray regions appear in the section chart, even though observation points are visible in the trajectory chart above.
Please keep this in mind when interpreting the charts.
-
BGC Parameter Charts May Have More Missing Areas
Vertical section charts in the OceanGraph interface are also available for BGC parameters (chlorophyll, nitrate, backscattering, pH, and PAR). Because only a subset of Argo floats carry BGC sensors, BGC data is available for fewer floats overall compared to temperature or salinity. For a section chart of a specific float that does carry a BGC sensor, the number of cycles with BGC data is generally the same as for physical parameters — however, quality control may still cause some individual cycles to be discarded, which can result in gaps.
Additionally, PAR profiles contain data only in the surface layer (roughly 0–200 dbar). Deeper portions of PAR section charts will always appear as missing areas, which is physically expected behavior.
Note also that of the two irradiance parameters (
DOWN_IRRADIANCE490andDOWNWELLING_PAR), only PAR is displayed as an in-app chart. Downwelling irradiance at 490 nm can make a profile match the “Only profiles with BGC” search filter and is included in downloadable profile data, but it does not have a corresponding in-app visualization.
Derived Metrics and Mode Water Detection
Derived metrics such as MLD, SOM, and mode water detections are calculated automatically from profiles that pass OceanGraph’s data processing checks. A no-data marker can mean that the source profile was insufficient for the calculation, or that the target feature was not detected under the current criteria.
Mode water detection uses fixed geographic, density, potential vorticity, and minimum-thickness criteria. The default geographic scope is configured to cover broader areas that can include advected mode water signals, but it is still an automatic bounding-box screen and may not cover every scientifically relevant signal. Treat the map overlay and Visual Lab summaries as exploration aids, and inspect the original profile structure when a research-grade classification is required.