Clustering
OceanGraph provides an experimental feature that clusters Argo profiles based on their vertical structure using machine learning. This functionality is experimental and comes with the following limitations and processing steps:
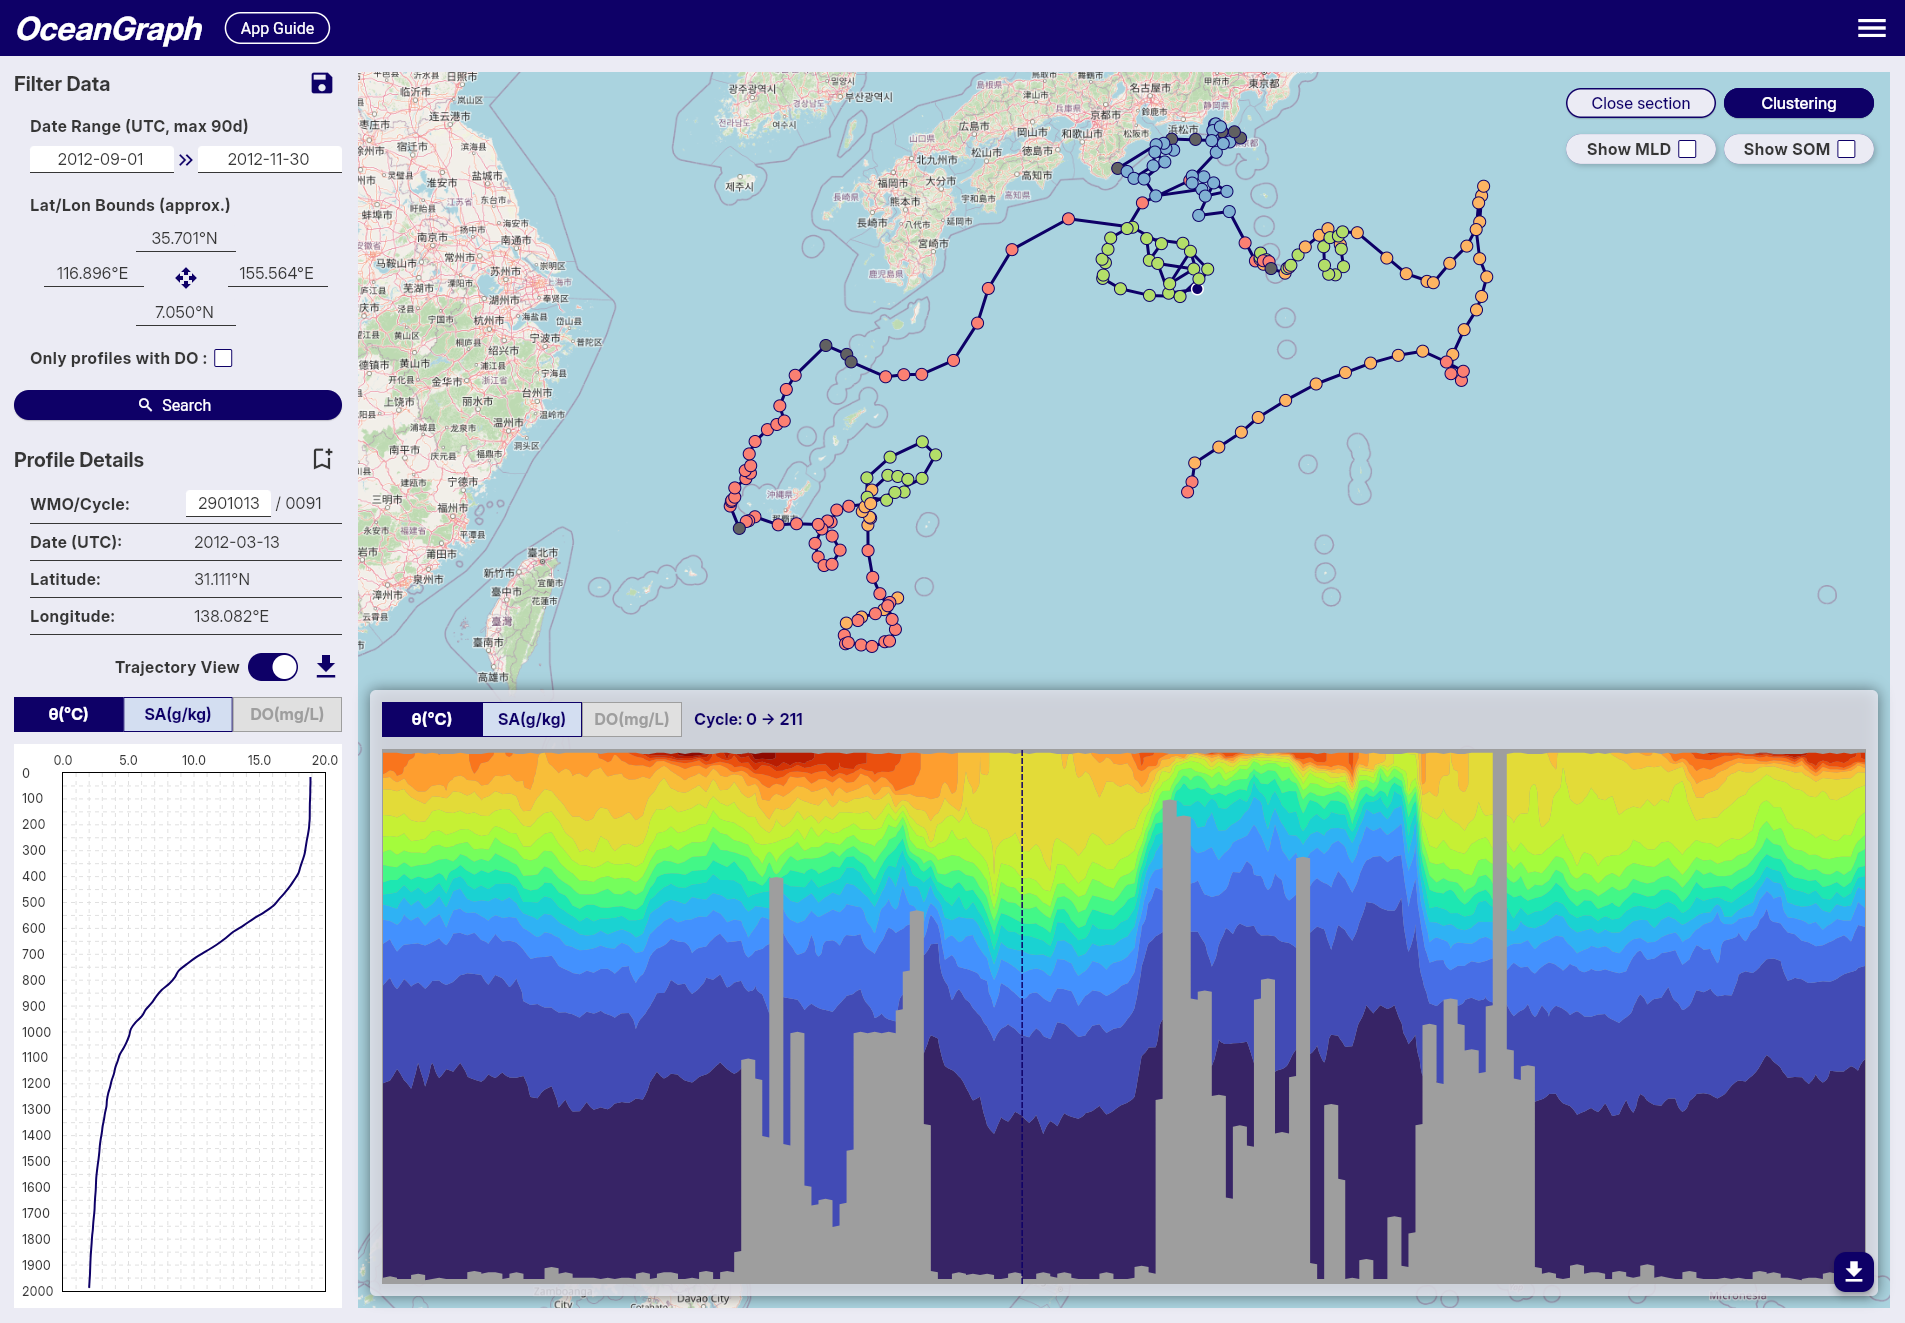 Note: Gray markers indicate profiles that were excluded from clustering.
Accessing Clustering
Clustering is available to signed-in users only.
- Sign in and perform a search
- Narrow the search results to 500 profiles or fewer
- Click the Clustering button in the top-right corner of the map
- Wait for the job to complete; the map markers are colored by cluster
If a clustering job takes too long, use the cancel control shown during processing. If polling fails, retry from the status message.
Interpreting Results
- Colored markers indicate profiles assigned to clusters.
- Gray markers indicate profiles excluded from clustering because they did not satisfy the required variables or depth coverage.
- The cluster labels are exploratory groups, not confirmed water-mass names.
Processing Details
-
Profile Limit
- To reduce server load and memory usage, clustering accepts a maximum of 500 valid profiles per job.
-
Depth Range & Interpolation
- The depth range used for clustering is dynamically determined based on the input profiles:
- Minimum depth: Fixed at 200 dbar to suppress the effects of seasonal thermocline and surface forcing.
- Maximum depth: Automatically set to the 25th percentile of maximum depths across all valid profiles, then rounded down to the nearest 100 dbar increment.
- If the calculated maximum depth is greater than 200 dbar and less than 1000 dbar, that value is used. Otherwise, the maximum depth falls back to 1000 dbar.
- Profiles that do not cover the selected depth range are excluded from clustering.
- Profiles are linearly interpolated every 100 dbar within this determined range to align them on a common vertical grid.
- This adaptive approach ensures optimal clustering performance regardless of the depth characteristics of the selected profiles.
- The depth range used for clustering is dynamically determined based on the input profiles:
-
Required Variables
- Only profiles containing valid temperature and salinity data are considered.
- Profiles missing these variables or lacking coverage in the specified depth range are excluded.
-
Clustering Feature Vector
- Clustering is based on a feature vector composed of interpolated temperature and salinity values, combined with location data.
- Temperature and salinity vectors are standardized using z-score normalization at each depth level to ensure that variations at all depths contribute equally to the clustering process.
- Latitude is included as an additional feature, normalized by linear scaling from -90 to 90 degrees into a range of -1 to 1.
- Longitude is transformed into two features using its sine and cosine values (i.e., sin(λ), cos(λ)), allowing for circular continuity around the ±180° meridian without further normalization.
-
Automatic K Determination
- The number of clusters (K) is selected automatically using a simplified elbow method (with a maximum of 6 clusters).