Trajectory and Time-Series Vertical Section
Use a time-series vertical section to compare oceanographic parameters by pressure and profile cycle along one float’s trajectory.
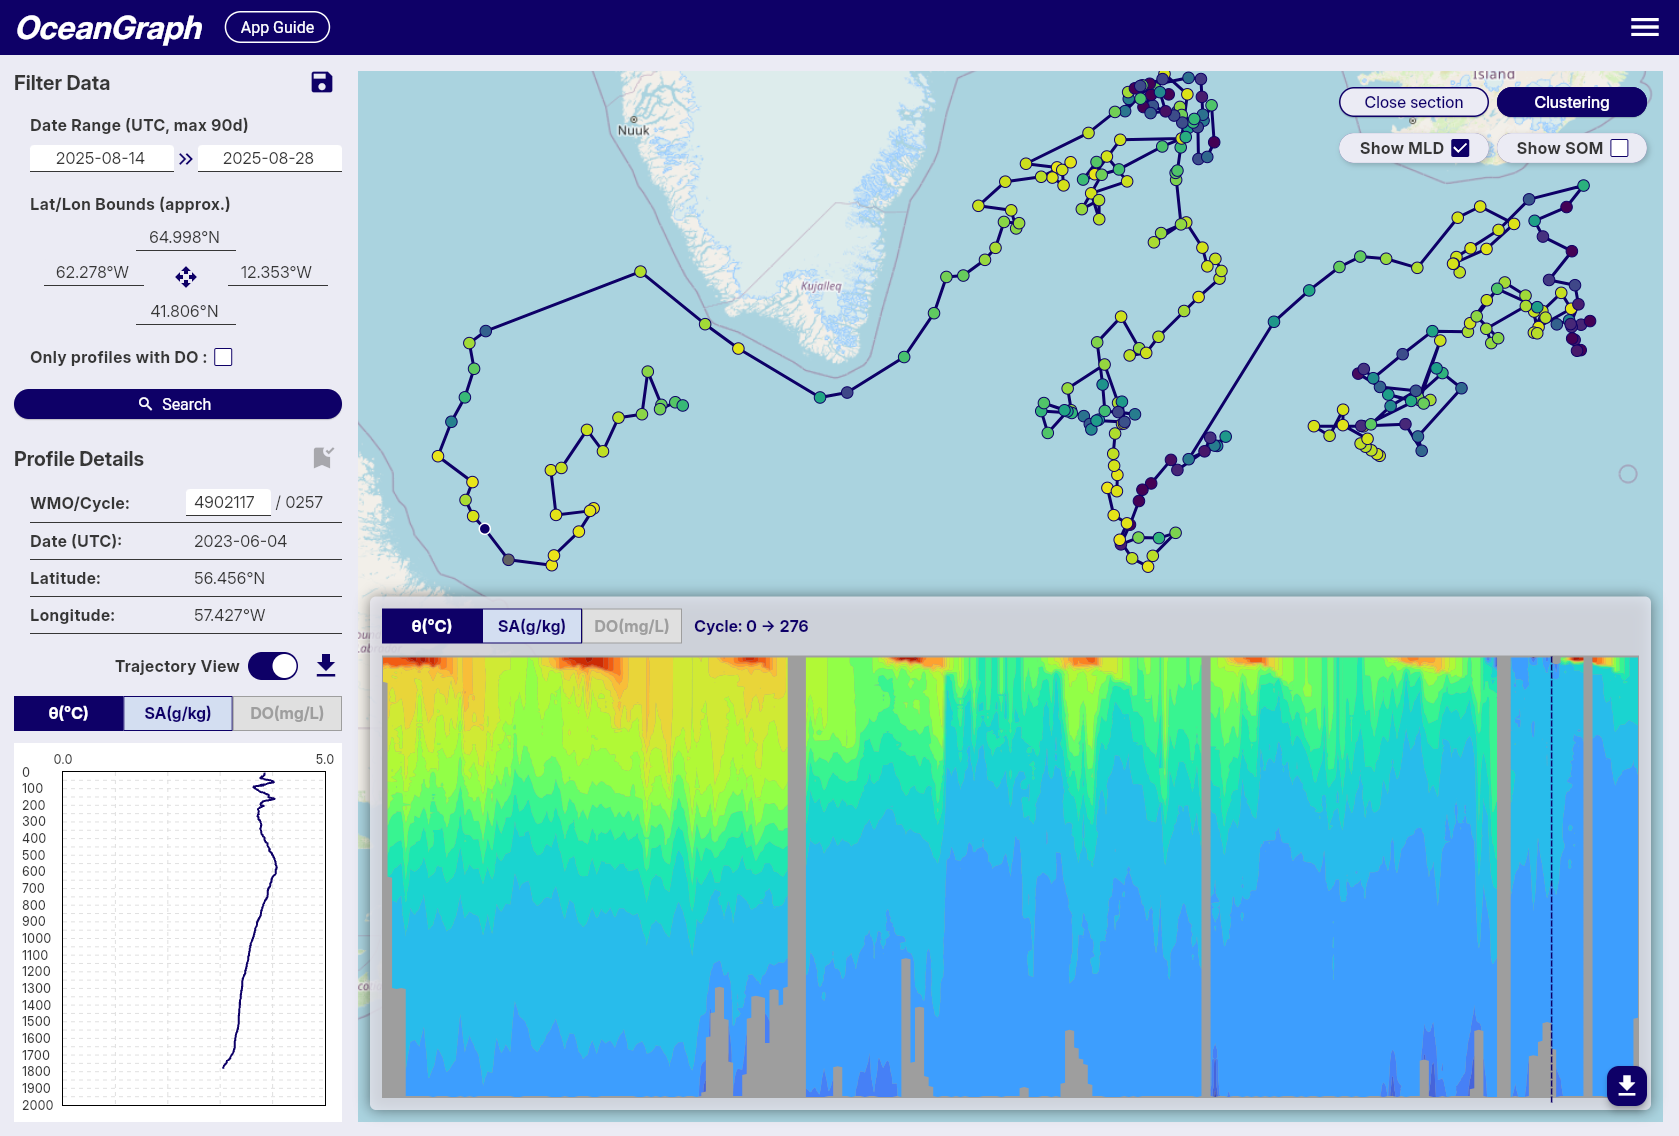
Accessing Time-Series Vertical Sections
To access time-series vertical sections of Argo float data, follow these steps:
- Select a Float: Start by selecting an Argo float from the search results or the map view.
- Turn on Trajectory View: In the upper-right map command bar, turn on Trajectory View to load every cycle from the selected float’s trajectory. Trajectory View is disabled until a profile is selected.
- Show vertical section: Open Analyze and select View section. On narrower layouts, open Map tools, then use the same Analyze item.
The Date Range continues to show the filter used for the original search. Trajectory View then loads all published cycles for the selected WMO ID, so Profile Details can show a cycle outside that range.
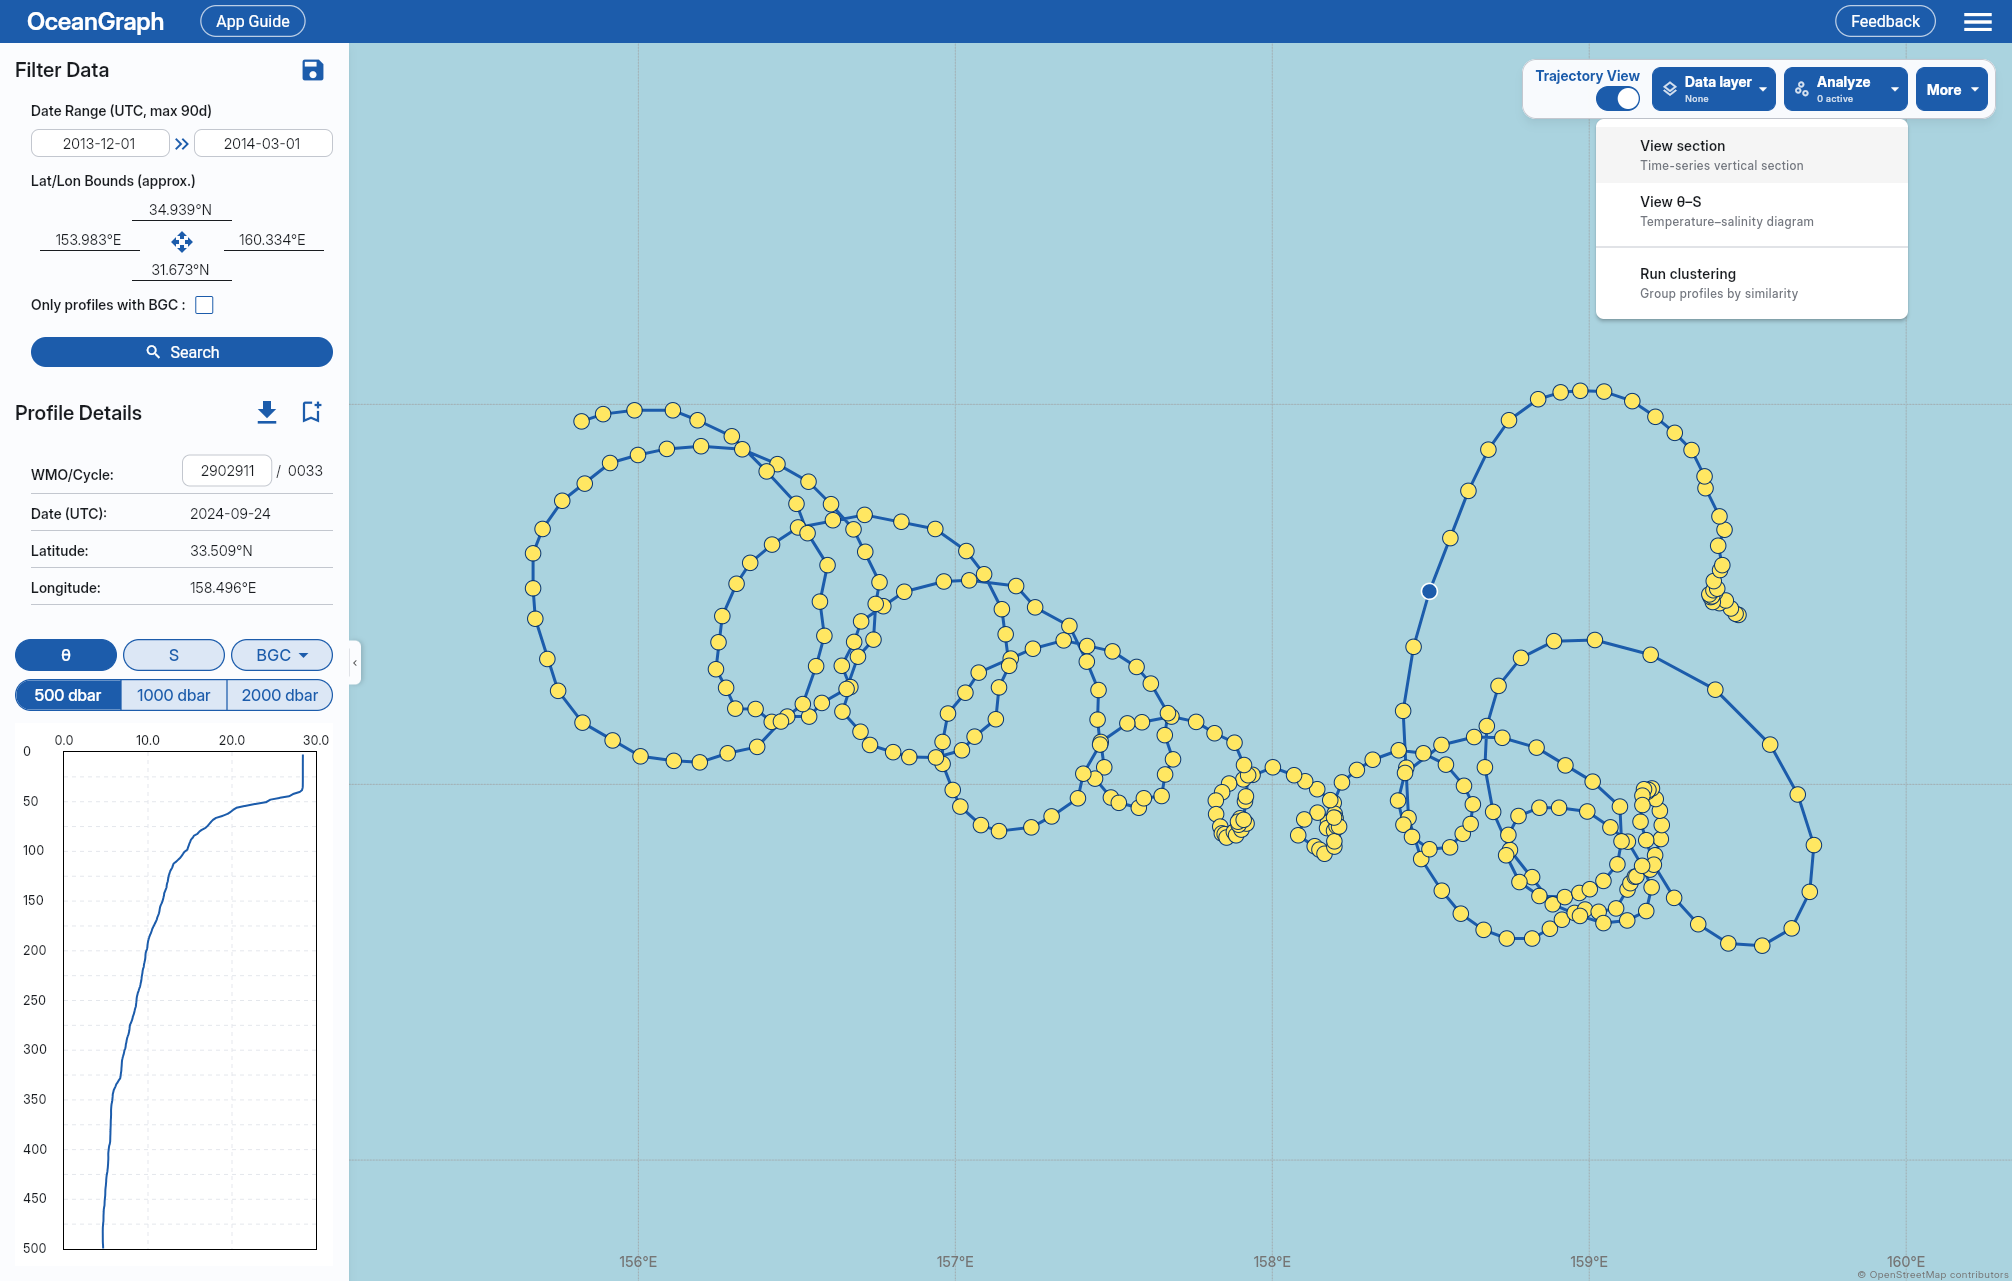
Turning Trajectory View off restores the profile that was selected when it started, even if you moved to another cycle. A new search clears that saved selection. Toggling Trajectory View closes the previous θ–S display, cancels an active θ–S or Clustering job, and closes the section when Trajectory View ends.
Signed-in users can also open θ–S from Analyze while Trajectory View is on. θ–S and the section can be displayed together; θ–S uses every cycle in the selected WMO trajectory. When both charts are visible, selecting a map marker or using the left and right arrow keys updates the selected marker, the section’s dashed line, and the highlighted profile curve in θ–S together.
Interpret the Section
- The vertical section is linked with the vertical profiles in Profile Details, and the position of the selected profile is shown with a dashed line.
- Every parameter uses the same 0–2000 dbar coordinate at 5 dbar intervals. The 500 and 1000 dbar views crop this coordinate, so colors and MLD/SOM data-layer points remain aligned. Values are not extrapolated above the shallowest finite observation.
- Missing areas mean unavailable, masked, or insufficiently supported values, not zero. Interpolation is limited to pressure within a profile; missing cycles remain gaps.
- A parameter with a published section displays its chart. If individual profiles contain usable values but adjacent cycles do not provide enough support to draw a section, the parameter remains selectable and the section area explains the limitation. A parameter with no usable profile data is disabled.
- Signed-in users can show MLD or SOM on the section chart when the corresponding Data layer is active.
- Each point represents a valid result for that profile cycle.
- A line connects valid results only when both cycle numbers are consecutive. It serves as a visual guide rather than exact interpolation between cycles.
- The data-layer line does not connect across gaps. A gap may represent an undefined or undetected result, observation or automatic-detection limitations, or a cycle that is absent from the loaded trajectory data.
Related Reading
For help interpreting patterns, gaps, and changes across repeated profiles, read Time-Series Vertical Sections in Oceanography Explained in OceanGraph Articles.