Ocean Temperature and Salinity Profiles Explained
If you are learning oceanography, one of the first plots you will encounter is a vertical profile of temperature or salinity. These plots look simple at first, but the interpretation is often less obvious than beginners expect. The challenge is not reading the axes. It is knowing what features in the profile actually matter.
Temperature and salinity profiles are fundamental because they show how the ocean changes with depth. They help you recognize surface layers, stratification, deep stability, and water-mass structure. Once you can read them well, many other oceanographic plots become easier to understand.
This guide explains how to read ocean temperature and salinity profiles, what common shapes mean, how to compare profiles from different places or times, and how to explore real Argo-based examples in OceanGraph.
If you want the broader data context first, read How to Read Argo Float Data for Beginners (What to Look at First).
Why Temperature and Salinity Profiles Matter
Ocean structure is vertical as well as horizontal.
A surface map can tell you where warm or cool water exists at the top of the ocean, but it cannot show:
- Whether that structure extends downward
- Whether the upper ocean is well mixed or strongly layered
- Whether fresh and salty layers align with temperature changes
- Whether two regions with similar surface conditions are actually very different below
Vertical profiles answer those questions.
They are especially useful for:
- Recognizing mixed layers and stratification
- Comparing seasonal or regional structure
- Interpreting water masses
- Understanding why a T-S diagram looks the way it does
- Screening profiles before deeper analysis
That is why profile reading is one of the most transferable skills in Argo float data analysis.
What a Vertical Profile Shows
A vertical profile plots one variable against pressure or depth.
In practice, you usually read the profile from top to bottom:
- The upper part represents the near-surface ocean
- The lower part represents deeper water
- The line shape shows how the variable changes through the water column
The most important beginner lesson is this: the shape matters more than one value.
When you read a profile, do not ask only:
- What is the surface temperature?
- What is the salinity at 500 meters?
Also ask:
- Is the upper layer uniform or strongly changing?
- Where does the strongest gradient occur?
- Is the deep water stable?
- Do temperature and salinity change together or differently?
That is how you move from reading numbers to reading ocean structure.
How to Read a Temperature Profile
Temperature is often the easiest profile to interpret first because the warm-cold dimension is intuitive.
Surface layer
Start at the top of the profile.
Ask:
- Is the surface relatively warm or cool?
- Does the upper layer stay nearly constant for some depth range?
- Is there a shallow or deep mixed layer?
A nearly uniform upper-temperature layer often suggests active mixing. A warm surface cap above cooler water often suggests stratification.
Thermocline
Below the surface layer, many profiles show a zone where temperature changes rapidly with depth. This is the thermocline.
A strong thermocline usually means:
- The upper ocean is clearly separated from deeper water
- Vertical exchange is more limited
- Small depth changes can correspond to large temperature differences
When the thermocline is sharp and shallow, the upper ocean is often strongly stratified. When it is weak or deep, the water column may be more mixed or seasonally different.
Deep water structure
Deeper in the ocean, temperature often changes more slowly than in the upper layers.
This deep part of the profile helps you judge whether:
- The lower water column is relatively stable
- There are deeper transitions or intrusions
- Two profiles differ mainly near the surface or throughout the whole water column
Beginners sometimes focus too much on the surface and miss the fact that deep similarity or deep difference is often scientifically important.
How to Read a Salinity Profile
Salinity can feel less intuitive than temperature, but it often carries equally important information.
Surface freshening and evaporation effects
Near the surface, salinity reflects processes such as:
- Rainfall
- River input
- Ice melt
- Evaporation
This means surface salinity can look very different even when temperature is similar. A fresher surface layer and a saltier surface layer imply different forcing and different density consequences.
Halocline
A strong vertical salinity gradient is often called a halocline.
Like the thermocline, the halocline marks a transition zone. It can indicate:
- Strong stratification
- Separation between surface and subsurface water types
- Fresh or salty layers that may not be obvious from temperature alone
When temperature and salinity both show strong gradients at similar depths, the water column often has a clear layered structure.
Salinity maxima and minima
Some profiles contain a notable salinity maximum or minimum below the surface.
These features are useful because they can suggest:
- A distinct subsurface water type
- The presence of water with a specific formation history
- Structure that is easy to miss if you inspect temperature only
This is one reason salinity profiles are so important in water-mass interpretation. They often reveal structure that would otherwise stay hidden behind a simple warm-cold view.
Reading Temperature and Salinity Together
The most useful interpretation happens when you read the two profiles together.
That is because:
- Density depends on both temperature and salinity
- Two profiles with similar temperature can still have very different salinity structure
- A surface layer may look simple in temperature but more complex in salinity
- A water-mass transition often becomes clearer when both variables are compared
A practical beginner workflow is:
- Read the temperature profile first.
- Read the salinity profile second.
- Ask where they change together and where they do not.
- Use a θ-S or T-S view if you need a more diagnostic interpretation.
This article pairs well with T-S Diagrams in Oceanography Explained (With Examples), because the T-S view is often the next step after you understand the vertical profiles.
Example 1: A Strongly Stratified Profile
Imagine a profile with:
- Warm surface water
- A sharp thermocline in the upper ocean
- Slightly fresher surface water
- Saltier subsurface water below
This kind of structure suggests a layered upper ocean with clear stratification.
What you would notice:
- The surface layer is strongly separated from the water below
- Temperature changes rapidly over a relatively small depth range
- Salinity adds another layer of structure instead of simply repeating the temperature pattern
In practice, this is the kind of profile where a follow-up θ-S diagram is especially useful, because it helps you see whether the layers correspond to distinct water-property combinations.
Example 2: A Mixed Surface Layer
Now imagine a profile with:
- Nearly uniform temperature in the upper ocean
- Nearly uniform salinity over the same depth range
- A deeper transition below that mixed layer
This often suggests recent mixing by wind, cooling, or seasonal forcing.
The important interpretation is not just that the surface values are similar. It is that the upper water column behaves as one layer for some depth range.
This kind of profile is easier to read than a strongly stratified one, but it is also easy to oversimplify. The deeper structure may still differ between profiles even when the upper layer looks similar.
Example 3: Comparing Two Profiles From Different Places or Seasons
Comparisons are where profile reading becomes much more powerful.
Suppose you compare two profiles:
- One from late summer
- One from winter
You may find:
- The summer profile has a warmer, shallower stratified surface layer
- The winter profile has a deeper mixed layer and weaker surface gradient
- Deep values are relatively similar between the two
That kind of comparison immediately tells you where variability is concentrated. It also helps separate seasonal upper-ocean change from more persistent deep structure.
The same logic applies to regional comparisons:
- Coastal vs offshore
- Subtropical vs subpolar
- One float cycle vs the next
This is why profile comparison is often a better first step than trying to interpret one observation in isolation.
Common Beginner Mistakes
Learning to read profiles is mostly about avoiding a few recurring mistakes.
Reading only the surface
The surface is visually easy to notice, but it is only one part of the water column.
Many scientifically important differences appear in:
- The depth of the mixed layer
- The strength of the transition zone
- The presence of deeper salinity extrema
- The similarity or difference of deep structure
Ignoring shape changes with depth
A profile is not just a list of values. It is a curve with structure.
The curve shape can reveal:
- Uniform layers
- Sharp gradients
- Subsurface features
- Stable deep water
If you read only individual values, you miss the physical meaning of the profile.
Looking at temperature without salinity
Temperature is easier to start with, but salinity is essential.
Without salinity, you may miss:
- Important density differences
- Fresh surface layers
- Salty subsurface water
- Water-mass distinctions that look weak in temperature alone
This is one reason profile interpretation naturally leads toward a T-S diagram rather than stopping with one line plot.
The Traditional Workflow: Plotting Profiles in Python First
Many people learn profile analysis by downloading Argo files and plotting them in Python.
That is a valid research workflow, but for beginners it creates friction:
- You need to work with NetCDF data structures
- You have to identify the right variables before seeing the figure
- You often debug code before you build any oceanographic intuition
- Comparing several profiles still takes time and setup
If your immediate goal is simply to understand what the profile shows, this can be heavier than necessary.
A Better First Step: Compare Profiles Interactively
Before writing code, it often helps to answer simpler questions visually:
- Which profiles are interesting?
- How does the upper ocean vary across cycles or regions?
- Does the salinity structure change with the temperature structure?
- Which cases are worth deeper analysis later?
OceanGraph is useful for this stage because it keeps the exploration workflow close to the scientific question.
With OceanGraph, you can:
- Search profiles by region, date, and WMO ID
- Keep the observation context visible
- Open vertical profiles directly
- Compare temperature and salinity structure visually
- Move to a θ-S interpretation when needed
Useful follow-up pages are:
- Search and Bookmark
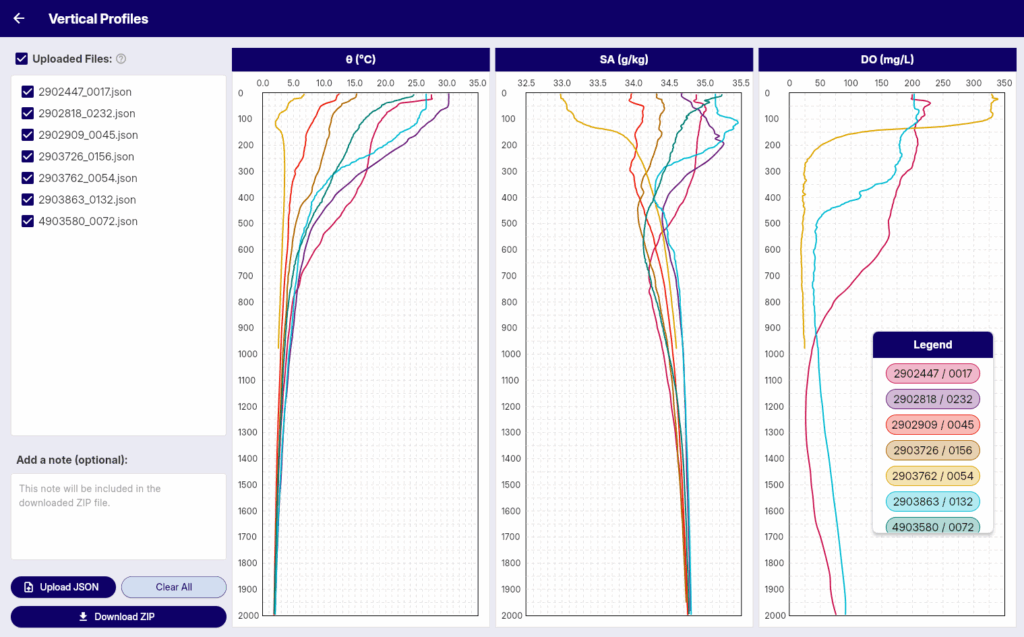
- Vertical Profiles
- How to Read Argo Float Data for Beginners (What to Look at First)
- T-S Diagrams in Oceanography Explained (With Examples)
Explore Profiles in OceanGraph
If you want to move from abstract profile theory to real observations, the next step is to open actual Argo-based profiles and compare them.
Try with real Argo data -> OceanGraph
Explore profiles interactively
OceanGraph makes it easier to understand ocean temperature and salinity structure before you commit to a more technical workflow.
Frequently Asked Questions
What should I read first in a vertical profile?
Start with the overall shape: the surface layer, the main gradient zone, and the deeper structure. Then compare temperature and salinity rather than reading only one variable.
Is pressure the same as depth in these profiles?
Not exactly, but for beginner interpretation it is usually fine to think of higher pressure as deeper water. The important point is the vertical structure, not the exact conversion.
Can I interpret a profile without a T-S diagram?
Yes. A vertical profile is often the best first step. But a T-S diagram becomes useful when you want to understand water-mass structure or the relationship between temperature and salinity more clearly.
Why compare more than one profile?
Because comparison shows whether a feature is persistent, seasonal, local, or unusual. One profile is informative, but multiple profiles make interpretation much more reliable.
Do I need Python to start reading profiles well?
No. Python is useful later for custom analysis, but it does not have to be the first step if your immediate goal is visual understanding.
Conclusion
Ocean temperature and salinity profiles are among the most useful plots in oceanography because they reveal the vertical structure that surface maps cannot show. Once you learn to read the surface layer, the main gradient zone, the deeper structure, and the relationship between temperature and salinity, profile interpretation becomes much more intuitive.
For most beginners, the fastest way to build that intuition is to compare real examples interactively. That is where OceanGraph helps.