How to Read Argo Float Data for Beginners (What to Look at First)
If you are new to Argo float data, the first obstacle is often not oceanography. It is figuring out what you are looking at. A raw Argo profile contains measurements, metadata, quality information, and cycle context, but when you first open the data it is not obvious which parts matter most.
That is why many beginners ask a practical question before anything else: how do you actually read Argo data? Not how do you download it, and not how do you code with it, but what should you look at first so the profile starts to make sense.
This guide explains how to read Argo float data step by step. It covers the basic fields, the main variables, the most common beginner mistakes, and a simpler workflow for exploring real Argo profiles in OceanGraph before you write Python.
If you are completely new to Argo itself, start with What is Argo Float? A Complete Guide to Ocean Observation Data.
Why Argo Data Feels Hard When You First Open It
Argo data is physically meaningful, but it is not always visually obvious.
When you first encounter a profile, you may see:
- A WMO ID
- A cycle number
- Latitude and longitude
- Time information
- Arrays of pressure, temperature, and salinity
- Quality flags and metadata fields
All of that is useful, but beginners often see it in the wrong order. They start from file structure or variable names instead of starting from the scientific question: where was this profile collected, when was it measured, and what does the water column look like?
That is the key shift. Argo data becomes easier when you read it as an observation of ocean structure, not as a file format problem.
What Argo Float Data Usually Contains
At the most basic level, one Argo profile combines:
- Context about the observation
- Measurements through the water column
- Metadata that helps you interpret the measurements correctly
The most common fields beginners need to understand are:
| Field | What it tells you |
|---|---|
| WMO ID | Which float produced the observation |
| Cycle number | Which profile event this is in the float’s sequence |
| Date and time | When the profile was taken |
| Latitude and longitude | Where the float surfaced or reported |
| Pressure | The vertical sampling coordinate |
| Temperature | Thermal structure of the water column |
| Salinity | Salt content and water-mass information |
| Quality flags | Whether a value passed quality control checks |
If you want a broader explanation of how floats, profiles, and cycles relate to each other, What is Argo Float? A Complete Guide to Ocean Observation Data is the best starting point.
The important practical point is this: you do not need to understand every metadata field before you can start reading a profile well. You need only enough context to interpret the measurement in place and time.
The First Things to Check Before Reading a Profile
Before focusing on the graph itself, check a few basics first.
1. Start with location and date
Ocean structure depends strongly on where and when the profile was taken.
A profile from the subtropical North Pacific in summer should not be interpreted the same way as one from the Southern Ocean in winter. Even before looking at the line shape, ask:
- Which ocean basin is this profile from?
- Is it coastal or open ocean?
- What season does the date imply?
- Is this a region where strong stratification, freshening, or deep mixing is common?
These questions keep you from over-interpreting the profile in isolation.
If you want to inspect this context directly before reading the graph, OceanGraph’s Search and Bookmark workflow is useful because it keeps date, location, WMO ID, and cycle information visible while you explore.
2. Check cycle number and profile context
One of the biggest beginner mistakes is treating a single profile as if it were the whole story.
Argo floats collect repeated profiles over time. That means one profile is usually part of a sequence. The cycle number helps you place the observation in that sequence.
This matters because:
- A feature may be persistent across many cycles
- A surface anomaly may appear only for one short period
- Deep structure may remain stable while upper-ocean structure changes
If you compare one cycle with nearby cycles from the same float, interpretation gets much easier. The best first question is often not “what is this line?” but “does this line look similar to the previous and next profiles?”
3. See which variables are available
Not every Argo profile contains the same variables.
Many profiles include the core physical variables:
- Pressure
- Temperature or potential temperature
- Salinity or absolute salinity
Some also include biogeochemical measurements such as:
- Dissolved oxygen
- Chlorophyll-related optical variables
- Nitrate
- pH
For beginners, it is usually best to start with temperature and salinity because they describe the basic physical structure of the water column. Once you understand those, the rest of the profile becomes easier to place in context.
How to Read the Main Variables
Once you know the profile context, move to the measurements themselves.
Temperature
A temperature profile is often the easiest place to begin.
Look for:
- A warm or cool surface layer
- A relatively uniform upper layer
- A sharp gradient below the surface
- Stable deep values
These patterns help you identify whether the upper ocean is strongly stratified, recently mixed, or transitioning between seasonal states.
When reading temperature, focus first on the shape of the profile rather than any single number. A single surface value matters less than whether the profile shows a shallow warm layer, a strong thermocline, or a gradual transition.
If you want a dedicated guide to profile interpretation, see Ocean Temperature and Salinity Profiles Explained.
Salinity
Salinity is often the variable beginners underestimate at first.
Temperature is intuitive because people already think in warm and cold. Salinity is less familiar, but in oceanography it is equally important because it helps distinguish water masses and contributes to density.
A salinity profile can show:
- Surface freshening from rainfall, runoff, or ice melt
- Surface salinification from evaporation
- A halocline or strong salinity gradient
- Subsurface salinity maxima or minima
Two profiles with similar temperature structure may still represent very different water masses if their salinity differs. That is why a temperature-only view is never enough for serious interpretation.
Pressure and depth
Argo profiles are usually organized by pressure, not literal geometric depth.
In many practical cases, pressure is close enough to depth to support intuitive interpretation, especially for beginners. But they are not identical, and it is better to think of pressure as the actual measured vertical coordinate.
For reading a profile, the practical lesson is simple:
- Higher pressure means deeper water
- Near-surface values are at low pressure
- Deep values are at high pressure
Do not get stuck on the conversion at the start. Focus on the vertical structure and relative changes first.
Quality flags and missing values
Another thing that confuses beginners is that some points may be missing, filtered, or flagged.
Quality information matters because oceanographic data is not just about plotting every number you see. Some values may need caution, especially in derived or biogeochemical fields.
You do not have to become a quality-control expert on day one, but you should remember:
- Missing points do not automatically mean the profile is useless
- One suspicious point should not outweigh the shape of the whole profile
- Apparent spikes may reflect data issues rather than physical structure
This is one reason visual inspection is so helpful. It is often easier to notice odd structure on a graph than in a table of numbers.
A Simple Example: Reading One Argo Profile Step by Step
Imagine you open one Argo profile from a subtropical region in late summer.
A practical reading sequence would look like this:
- Check the location and date.
- Confirm which float and cycle you are looking at.
- Open the temperature profile.
- Look for the surface layer, the main gradient, and the deep structure.
- Open the salinity profile and ask whether it reinforces or changes your first interpretation.
- Compare with nearby cycles or nearby profiles.
- Use a T-S style view if you want to understand the water-mass relationship more clearly.
Suppose the temperature profile shows:
- Warm surface water
- A clear thermocline below it
- Relatively stable deeper values
Then the salinity profile shows:
- Slightly fresher surface water
- A saltier subsurface layer
- More stable deep salinity
That already tells you much more than “this file contains numbers.” It suggests a stratified upper ocean, surface modification processes, and a subsurface layer with distinct water properties.
The next useful step is not necessarily more code. It is often comparison.
If you compare two nearby cycles and see that the deep structure is stable while the surface layer changes, you learn something physically meaningful about variability. If you open a θ-S view and see a compact deep-water cluster plus a broader surface spread, that interpretation becomes even stronger.
OceanGraph supports this kind of workflow with:
What Beginners Often Misread
Even when the graph is visible, a few mistakes come up repeatedly.
Confusing pressure with depth
Pressure is the profile coordinate you will most often see. It is fine to read it intuitively as “deeper downward,” but do not assume the label is literally depth if the dataset says pressure.
Looking at one point instead of the profile shape
A profile is not a collection of isolated numbers. It is a vertical structure.
If you focus on one value instead of the shape, you can miss:
- The mixed layer
- The main gradient zone
- Subsurface extrema
- Whether the deep water is uniform or changing
Ignoring data quality information
Not every value deserves the same confidence. If the shape looks strange, especially in a small part of the profile, consider that data quality may be part of the explanation.
The safest beginner habit is to trust the broad structure first and treat isolated odd points with caution.
The Traditional Workflow: Download, Decode, Then Plot
A common Argo workflow looks like this:
- Download NetCDF files
- Inspect variable names and metadata
- Decide which arrays matter
- Handle quality flags
- Write code to plot temperature and salinity
- Repeat the process for the next profile
That workflow is valid for research, but it can be a poor first experience for beginners. The problem is not that coding is wrong. The problem is that it forces you to solve a software workflow before you have built any intuition about the ocean structure.
This is exactly why many people end up searching for simpler paths such as Visualizing Argo Float Data Without Python (Step-by-Step Guide).
A Better First Step: Explore Argo Profiles Interactively
If your goal is to read Argo data rather than automate it immediately, interactive exploration is often the better first step.
OceanGraph helps because it keeps the interpretation workflow in the right order:
- Search by region, date, and WMO ID
- Check profile context
- Open the vertical profile
- Compare multiple observations
- Use a θ-S diagram when you need water-mass interpretation
That lets you learn the data structure through actual examples instead of through file parsing alone.
Good follow-up pages after this article are:
- Ocean Temperature and Salinity Profiles Explained
- T-S Diagrams in Oceanography Explained (With Examples)
- Visualizing Argo Float Data Without Python (Step-by-Step Guide)
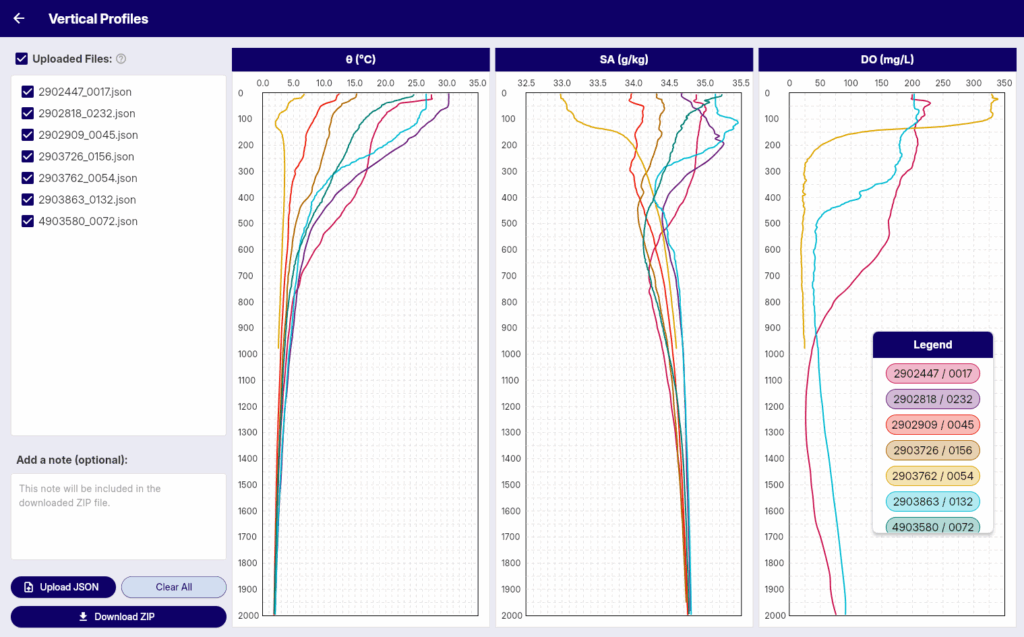
- Vertical Profiles
Try Real Argo Data in OceanGraph
If you want to move from “I know the field names” to “I can actually read the profile,” the next useful step is to open real data and compare it visually.
Try with real Argo data -> OceanGraph
Explore profiles interactively
OceanGraph helps you build intuition about Argo profiles before you invest time in a heavier coding workflow.
Frequently Asked Questions
What should I check first in an Argo profile?
Start with location, date, float ID, and cycle number. That gives the profile context before you interpret the graph itself.
Is pressure the same as depth?
Not exactly. Pressure is the measured vertical coordinate used in many ocean datasets. For beginner interpretation, it is usually fine to think of higher pressure as deeper water.
What variables should I read first?
Start with temperature and salinity. They provide the clearest first view of physical ocean structure and water-mass differences.
Do I need to understand NetCDF before I can read Argo data?
No. NetCDF becomes useful when you want custom processing, but it does not have to be your first step if your immediate goal is interpretation.
What should I read after this guide?
The best next steps are Ocean Temperature and Salinity Profiles Explained and T-S Diagrams in Oceanography Explained (With Examples).
Conclusion
Reading Argo float data becomes much easier when you stop treating it as a file first and start treating it as an observation of ocean structure. The most useful beginner workflow is simple: check the profile context, read temperature and salinity against pressure, compare nearby observations, and only then worry about heavier technical steps.
That is where OceanGraph becomes useful. It lets you see real Argo data in the order that supports understanding first.